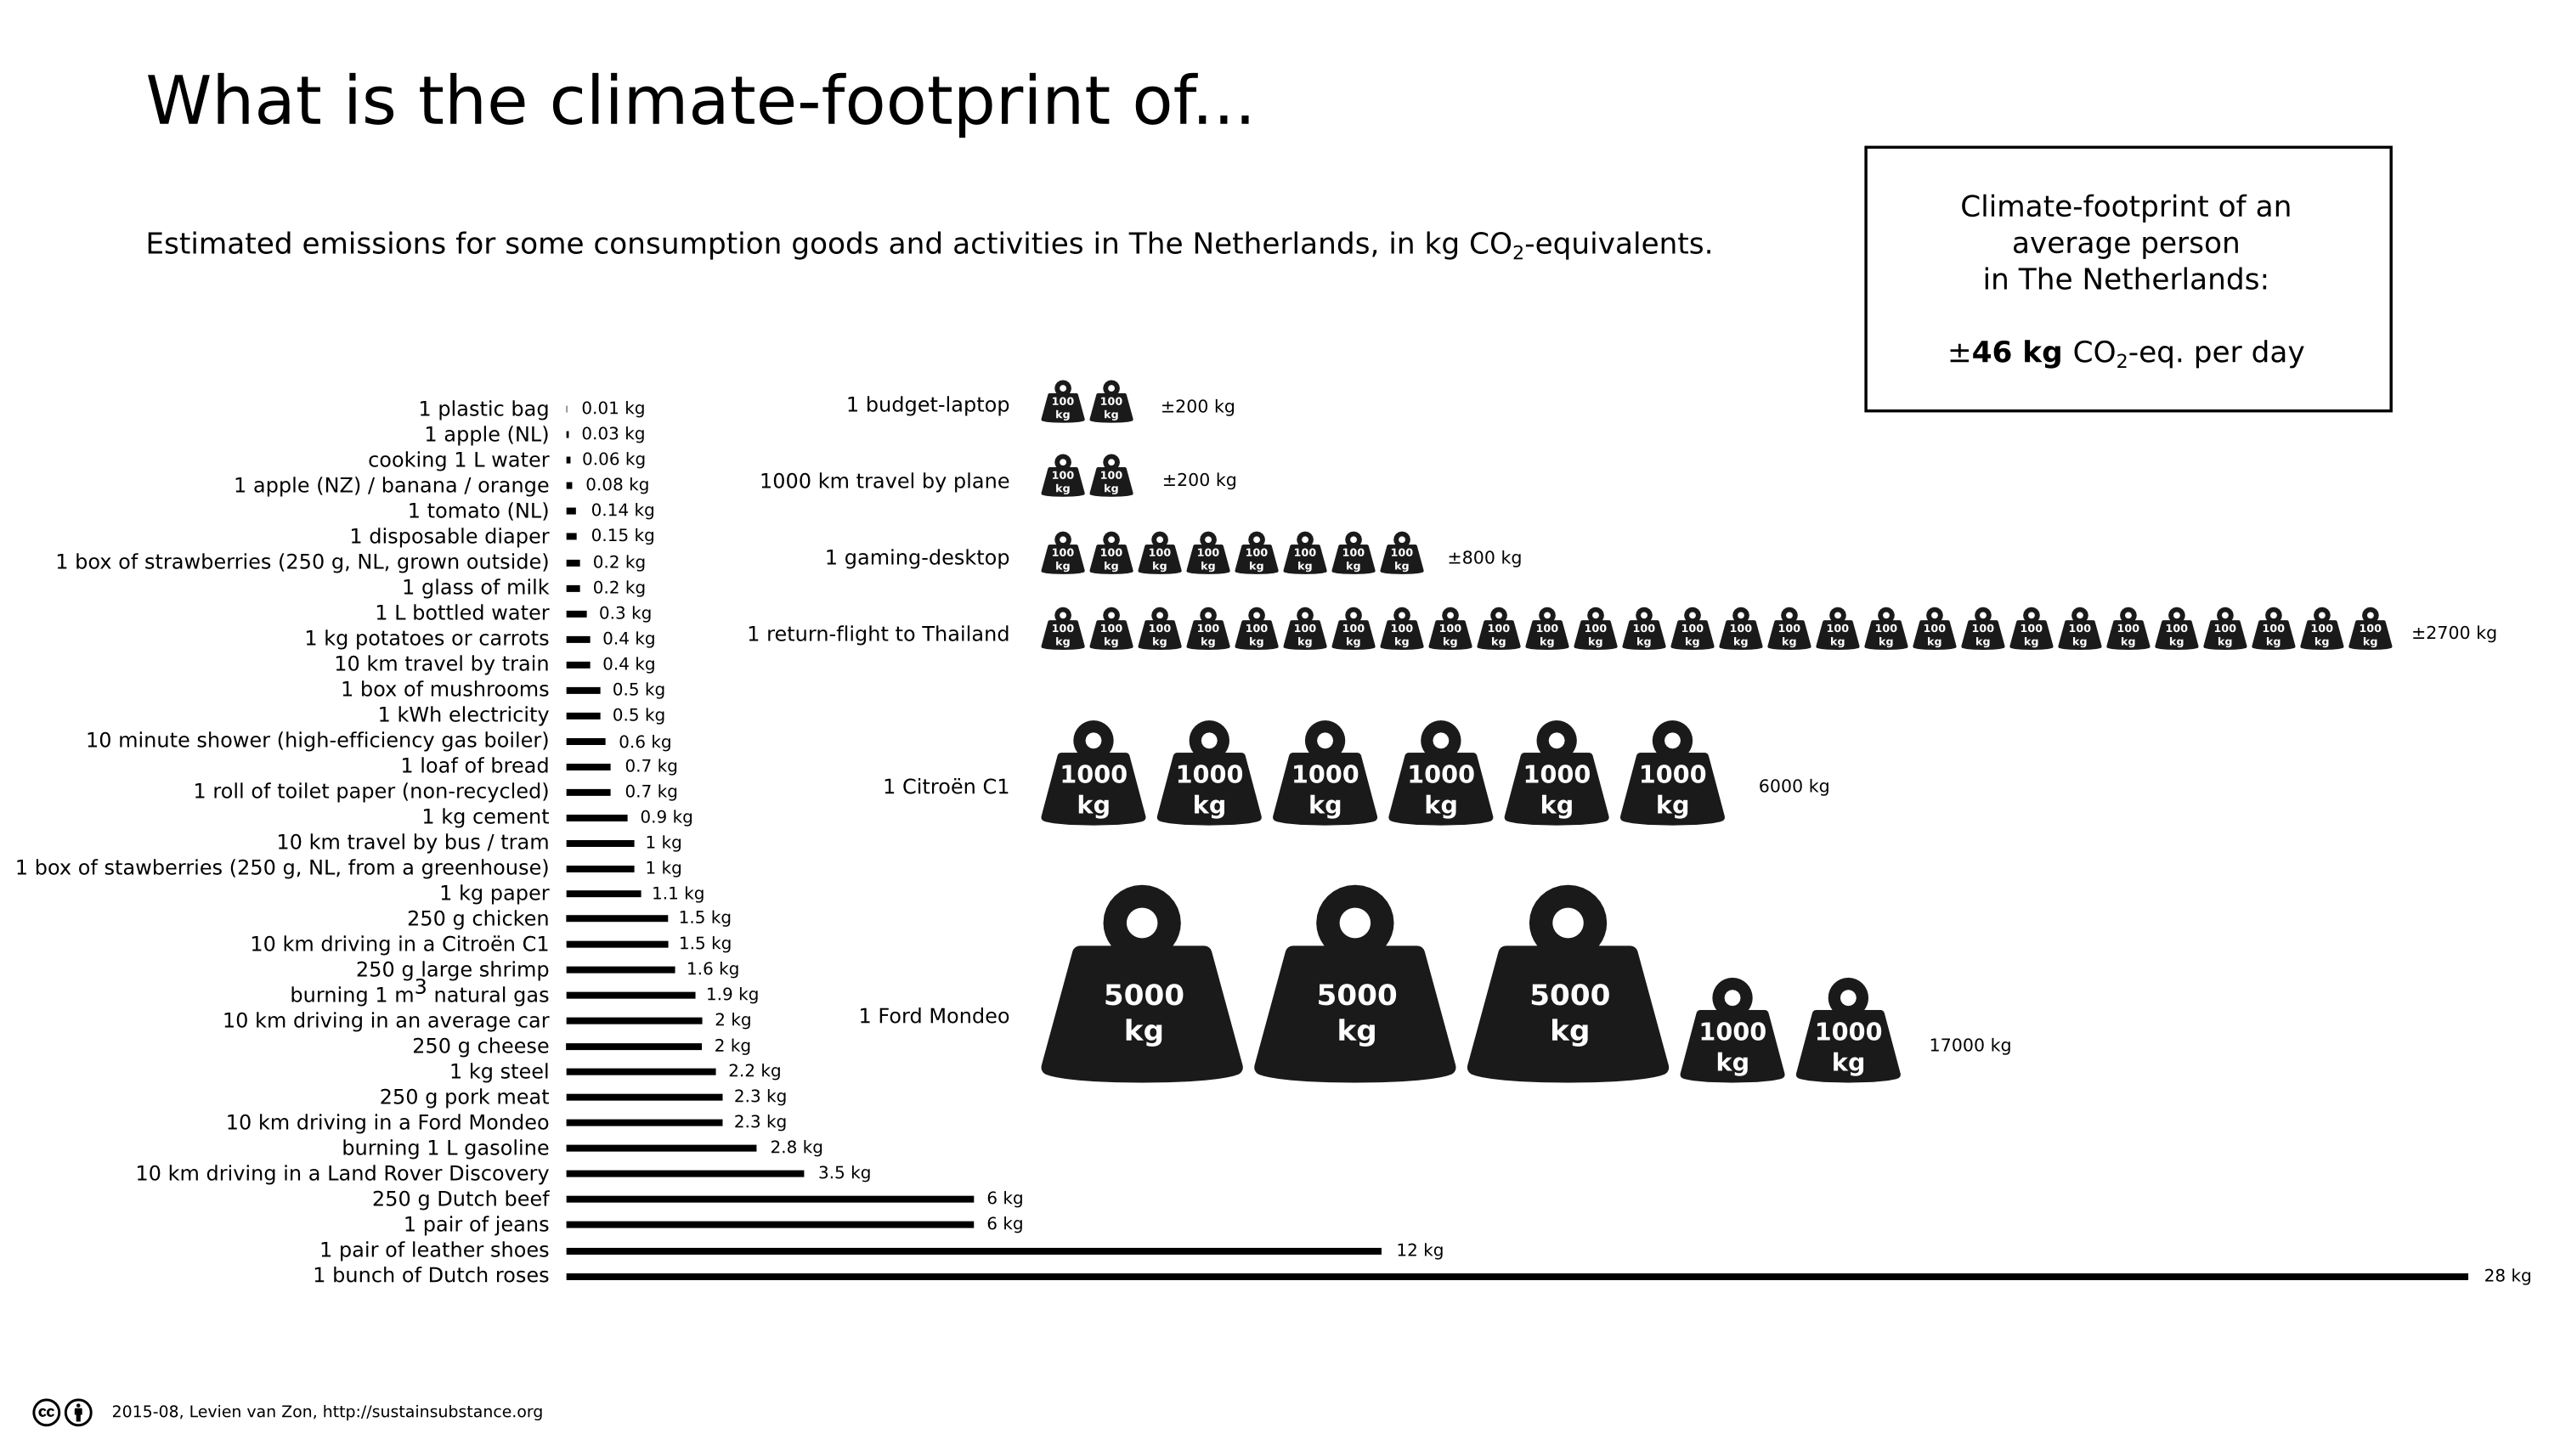
This figure shows estimated greenhouse gas emissions for several consumption goods and activities, in kg CO2-equivalents (click on the image to enlarge).
Sources:
-
The estimated emissions for a plastic bag, a banana, an orange, a disposable diaper, bottled water, carrots, a roll of toilet paper, 1 kg cement, 1 kg steel, a pair of jeans, a pair of leather shoes, a budget laptop, a gaming desktop, a Citroën C1 and a Ford Mondeo were taken from the book How Bad are Bananas? The Carbon Footprint of Everything by Mike Berners-Lee (2010).
- The footprint of a plastic bag is based on http://lca.plasticseurope.org.
- The figures for bananas and oranges are based on Wallén, Brandt en Wennersten, 2004.
- The emission of a diaper is based on An updated lifecycle assessment study for disposable and reusable nappies.
-
The emission-estimates for a glass of milk (155 mL), a load of bread (800 g) and a portion of shrimp (250 g) are based on the Dutch report Milieueffecten van Nederlandse consumptie van eiwitrijke producten - Gevolgen van vervanging van dierlijke eiwitten anno 2008 by Blonk Milieuadvies (October 2008).
-
The estimated emissions of 250 g cheese, chicken, pork and beef were taken from Annex A of Life Cycle Impacts of Protein-rich Foods for Superwijzer, a report by CE Delft (August 2011). These estimates assume regular Dutch animal agriculture, and differ somewhat from the estimates of Blonk Milieuadvies (2008). The latter estimate 2.2 kg CO2-eq for 250 g cheese, 0.7 kg for 250 g chicken, 1.1 kg for pork and 4 kg for beef. The differences between the two studies in their estimates for meat are fairly significant, and result from differences in assumptions and methodology. For instance, the life cycle analyses of CE Delft include estimates of the extra net emission caused by land-use changes for cultivation of soy for animal feed, while the analyses of Blonk does not. One could argue in favour of both methods, because while land-use changes due to feed cultivation are an important secondary impact of meat production, their effect is very hard to quantify. However, as the CE Delft report describes their methodology in some detail, and as I think that the effects of growing animal feed should be taken into account, I chose to use the figures of CE Delft.
-
The estimated carbon footprints of an apple (from The Netherlands and New-Zealand), a banana (From Ecuador), a tomato (grown in a Dutch greenhouse with CHP), 250 g mushrooms (fresh, grown in The Netherlands, harvested by hand) and 250 g strawberries (grown outside and grown in a Dutch greenhouse) are based on figure 3.1 in the report Berekening van broeikasgasemissies door de productie van tuinbouwproducten by Blonk Milieuadvies (May 2009). The (rather large) footprint for a bouquet of Dutch roses is based on figure 3.2 in the same report, and assuming 20 roses of 60 g each.
-
The estimated emissions from generating 1 kWh of electricity is based on the Dutch List of CO2-emission-factors and on the publication Berekening van de CO2-emissies, het primair fossiel energiegebruik en het rendement van elektriciteit in Nederland by Agentschap NL, CBS, ECN and PBL (2012), and the update published one year later. The average emission of electricity generated in The Netherlands was 0.46 kg CO2-eq per kWh in 2010, and 0.44 kg CO2-eq per kWh in 2011. These figures include renewable sources, without renewables the numbers are 0.57 kg CO2-eq per kWh in 2010 and 0.57 kg CO2-eq per kWh in 2011. These numbers only include the direct emissions from the power plants, corrected for transport losses, but ignoring indirect emissions. The List of CO2-emission-factors quotes an emission of 0.526 CO2-eq per kWh for non-renewable electricity (“grijze stroom”), including the indirect emissions for fuel production. This is the figure I used, however it does not account for the electricity generated from renewable sources in The Netherlands, which is currently below 5% of the total.
-
The footprint of 1 kg of paper is based on the emission factors of de Climate Neutral Group. The emissions for glossy print publications are somewhat higher, and for books they are about twice as high.
-
The emissions from boiling 1 litre of water depend strongly on the starting temperature and the method of heating. Heating 1 L water from 10-20 degrees Celsius to 100 degrees requires ca. 0.1 kWh of energy. An electrical cooker will generally use around one-and-a-half times this theoretical value, due to heat loss and several seconds sustained boiling. When using gas, the energy requirement strongly depends on heat loss, which in turn depends on the relative size of the pan or kettle used, and on whether it is covered. An emission of 0.06 kg CO2-eq per litre is realistic for an electrical kettle, but probably somewhat on the high side for gas, provided a good kettle or cover is used. While in theory an electric kettle is more efficient than cooking on gas, this advantage is generally offset by the low (50-70%) efficiency of generating electricity from coal or gas.
-
The CO2-emissions from taking a 10-minute shower will obviously depend on things such as the shower head used, the water temperature, the method of heating and the efficiency of the heater. The estimate of 0.57 kg CO2-eq per 10 minuten is based on my own shower, which has an ancient model shower head, and is heated by an Intergas Kombi Kompakt HR 22 gas-heater with a theoretical efficiency of around 85%. The water is heated to around 60°C, and the shower uses around 3 L of hot water per minute, mixed with cold water to attain a comfortable temperature. The average amount of gas used by my shower is around 0.03 m3/min, which translates to around 0.057 kg CO2-eq per minute (not accounting for any indirect emissions).
-
The footprints of travelling 10 km by local train, bus, tram or average car, burning gas and gasoline and flying 1000 km, are based on the Dutch List of CO2-emission-factors.
-
The estimated emissions of travelling 10 km in a Citroën C1, a Ford Mondeo and a Land Rover Discovery are based on average fuel consumption figures from the Autoweek Verbruiksmonitor. The average fuel consumption of a C1 is 0.534 L gasoline per 10 km (which gives a range of 19 km/L), the Mondeo uses 0.839 L gasoline per 10 km (and drives 12 km/L), and the Land Rover uses 1.1 L diesel per 10 km (and drives 9 km/L). I have assumed an emission of 2.8 kg CO2-eq per L gasoline, and 3.2 kg CO2-eq per L diesel.
-
A return-flight Amsterdam - Bangkok is roughly 18340 km. At an average emission of 0.147 kg CO2-eq per passenger-km for intercontinental flights, this flight would emit roughly 2696 kg CO2-eq per passenger. This is equal to around two months of emission by an average Dutch consumer, and the emitted CO2 for a single passenger weighs more than a Land Rover Discovery! In fact, a typical large plane burns around 10 tonnes (10,000 kg) of fuel per flying hour (and a bit more during the first hour). This means that a single 11-hour direct flight would go through nearly 120 tonnes of jet fuel. Assuming 400 passengers, this would be “only” 300 kg of fuel per passenger. But burning one kg of jet fuel releases around 3.1 kg CO2-eq, so we would emit 938 kg CO2-eq per passenger on such a single flight. And as not all flights are direct, and not all planes carry 400 passengers, we should expect a bit more on average.